Company Overview
SK hynix is a semiconductor manufacturer focused on memory products, including DRAM and NAND flash. Its products serve computing, mobile and data-center markets, where demand, product mix and manufacturing capacity affect results.
SK hynix traces its roots to Hyundai Electronics' semiconductor business, which later became Hynix Semiconductor. After the SK Group acquired a controlling stake, the company was renamed SK hynix and expanded its memory manufacturing in South Korea and China.
The company also acquired Intel's NAND flash and SSD business, which became Solidigm. In recent years, SK hynix has become known for its leadership in high-bandwidth memory for AI accelerators.
Latest Quarterly Results: Q3 2026
SK hynix reported preliminary third-quarter 2026 results on October 28, 2026.
Net profit was well below operating profit because the company reported about ₩32.63 trillion of net non-operating losses in the quarter.
SK hynix said its DRAM and HBM supply is booked under long-term agreements into 2029.
Business Model and Revenue Drivers
Memory products are cyclical, and pricing can respond to supply discipline, customer inventories and changes in end-market demand.
Advanced memory products require research, manufacturing investment and customer qualification; successful production and shipments are different measures.
The company's home-market listing and any overseas trading instruments can have different currencies, liquidity and trading hours.
Competitive Landscape
SK hynix competes primarily with Samsung and Micron in DRAM and high-bandwidth memory, and with those companies plus Kioxia, SanDisk and Chinese producers in NAND flash.
In HBM, the key factors are technology leadership, production yields, qualification with AI chip designers and capacity to ship at scale. Early success in HBM helped strengthen SK hynix's position with major customers.
Revenue Growth and Financial Performance
When reviewing SK hynix's reported results, these measures give the clearest view of growth, profitability and cash generation:
- Revenue, operating margin and sales mix by memory category
- DRAM and NAND prices, inventory and shipment trends
- Capital expenditure, yields and manufacturing capacity
- Cash flow, debt and balance-sheet liquidity
- Customer concentration and geographic revenue disclosures
Profitability and Earnings Quality
Revenue growth is only part of the picture. For SK hynix, it helps to check whether growth comes from higher volumes, higher prices or acquisitions, and whether margins are widening or narrowing as the business scales.
Reported earnings can include one-time items such as restructuring charges, asset sales, tax effects or legal settlements. Separating these from recurring operating results, and comparing like-for-like periods, gives a more reliable view of underlying profitability.
Balance Sheet, Debt and Financial Stability
A review of SK hynix's financial position starts with cash, total debt, lease obligations and how operating cash flow compares with capital spending. A business that funds its investment from its own cash flow is in a different position from one that relies on borrowing or issuing new shares.
Changes in inventory, receivables and working capital are also worth monitoring, because they can absorb cash and signal shifts in demand before they appear in revenue.
SK hynix Stock Valuation Analysis
Measures such as the price-to-earnings ratio, price-to-sales ratio and enterprise value to EBITDA describe how the market is currently pricing SK hynix relative to its results.
However, a single valuation ratio cannot establish whether a stock is undervalued or overvalued. Earnings quality, free cash flow, margins, competitive position and the growth needed to support the current price all need to be considered together, and compared with similar companies.
Business Outlook and Investment Risks
Management guidance and industry conditions shape expectations for SK hynix, but guidance is an estimate rather than an established outcome. Several uncertainties are specific to this business:
- Memory-price and supply-demand cycles
- Large, ongoing capital requirements and technology transition costs
- Competition and customer concentration
- Currency, trade-policy and geopolitical exposure
How Memory Products Differ
DRAM and NAND both store digital information, but they perform different jobs. DRAM provides temporary working memory for processors and loses its contents when power is removed. NAND retains data without power and is used for storage. This distinction shapes purchasing decisions: a server needs memory to feed active workloads and storage to retain files and databases. The two markets therefore respond to different technical requirements, even when the same customer buys both products.
Memory is sold in several forms. A bare chip can be incorporated into a customer's device, while a module combines chips into a product designed for a particular system. An SSD adds a controller and software to NAND flash, managing data placement and correcting errors. These added functions affect performance and reliability, so an SSD supplier competes on more than the characteristics of the underlying flash chips. Product-level disclosures can help distinguish chip manufacturing from the broader storage offering.
Inside High Bandwidth Memory
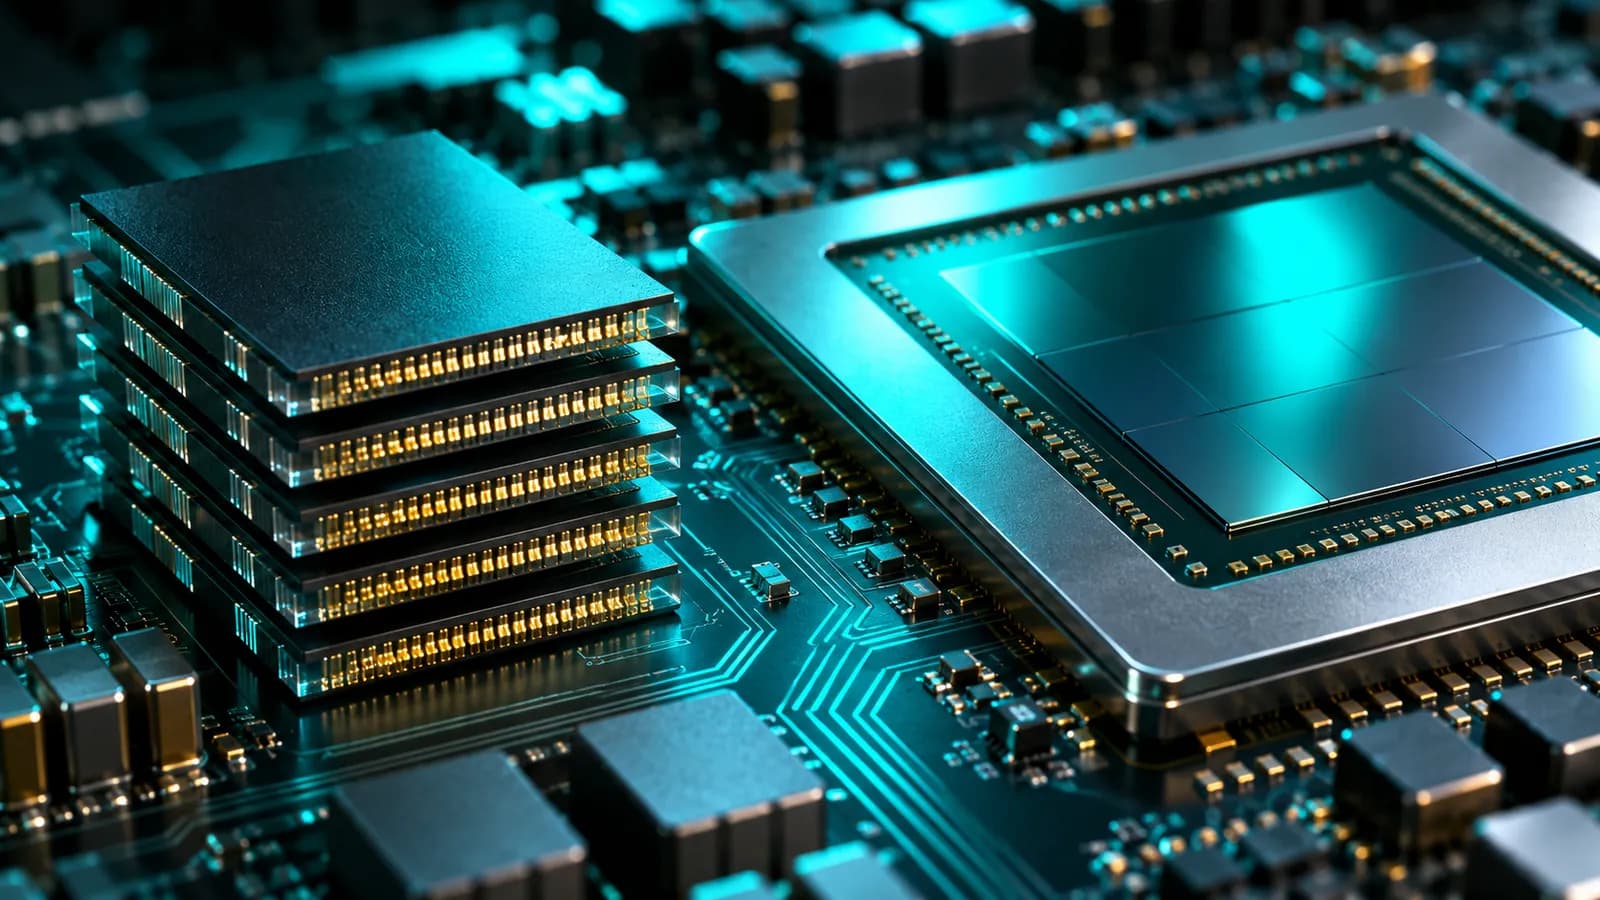
High-bandwidth memory stacks DRAM dies vertically and connects them through tiny electrical pathways. The stack sits close to a processor in an advanced package, allowing many connections to move data in parallel. Bandwidth describes the rate at which data can be transferred; capacity describes how much data can be stored. They are related design considerations, but a system with more memory capacity does not automatically have the bandwidth needed to keep a demanding processor supplied.
A finished stack depends on several stages working together, including making the dies, selecting usable components, stacking them and integrating them into a package. A defect at a later stage can affect the value of work completed earlier. The memory maker, processor designer and packaging partners must also coordinate interfaces and thermal behavior. This makes the economics of a stack different from those of a standalone DRAM chip, even though both use DRAM technology.
Manufacturing Economics And Depreciation
A fabrication plant converts silicon wafers into many individual chips through repeated processing steps. The number of usable chips depends on the design's size and the share that pass testing. A process change can improve the number of chips produced from a wafer, but the benefit also depends on defects and the complexity of manufacturing. Examining wafer output alone therefore gives an incomplete picture of usable production and cost per chip.
Manufacturing equipment is recorded as an asset and its cost is generally recognized over its useful life through depreciation. The cash spent on equipment and the resulting expense in reported profit can occur in different periods. Depreciation also forms part of inventory cost before that inventory is sold. Reading the cash flow statement alongside the notes on fixed assets and depreciation helps explain why accounting profit and cash generated during a period can differ.
Reading Inventory And Commitments
Memory inventory includes materials, partially completed wafers and finished products. A rise in its reported value can reflect a change in physical quantities, production costs or product mix. Accounting write-downs can also change the carrying value when inventory is expected to recover less than its recorded cost. Notes to the financial statements can provide context that a single inventory balance cannot, particularly when comparing periods with different manufacturing conditions.
Purchase and supply agreements deserve attention alongside recognized debt. Their terms may address quantities, delivery schedules, pricing arrangements or conditions for changes, but a headline description of an agreement does not reveal every obligation. Financial statement notes and management explanations can clarify which commitments are recorded as liabilities and which are disclosed separately. Comparing the wording across reporting periods can also show whether the nature of the commitments has changed.
Conclusion: Is SK hynix Stock Worth Analyzing in 2027?
SK hynix has a business model with clear drivers that can be tracked through its reported results, and a set of risks that are specific to its industry and financial position.
A balanced assessment considers growth, profitability, balance-sheet strength, valuation and risk together. SK hynix is a company worth monitoring for what its results reveal about its business.