Company Overview
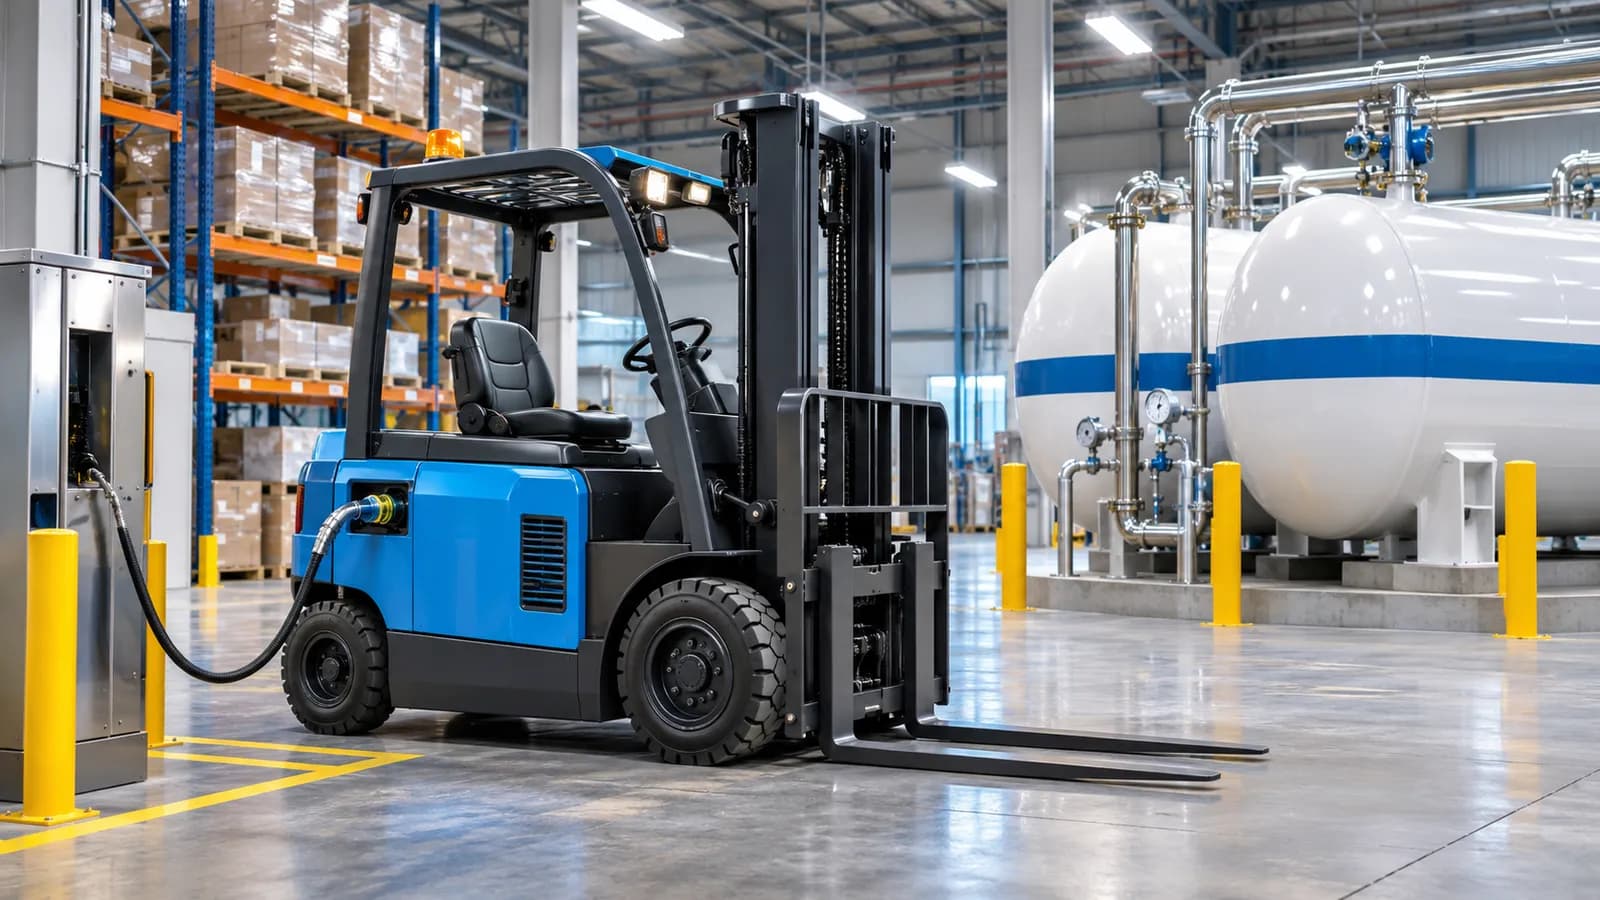
Plug Power builds hydrogen fuel cell systems, most widely used to power forklifts in warehouses, and electrolyzers that produce hydrogen from water using electricity. It trades on Nasdaq under the ticker PLUG. The company also produces and delivers hydrogen to customers.
Plug Power started in fuel cell research and found its first major market supplying fuel cells for forklifts used by large retailers and distributors.
It later expanded into electrolyzers and green hydrogen production plants, aiming to build a full hydrogen supply chain.
Latest Quarterly Results: Q3 2026
Plug Power reported third-quarter 2026 results on November 9, 2026.
The quarter's reported profit came from non-cash fair-value gains; for the first nine months of 2026 the company still reported a net loss of about $337 million.
Gross margin improved sharply but remained slightly negative, partly due to unplanned downtime at some hydrogen plants.
Business Model and Revenue Drivers
Plug's strategy is to offer an integrated hydrogen ecosystem: equipment, fuel production and delivery.
The company has reported large losses and negative gross margins in several periods, partly because the cost of producing and delivering hydrogen exceeded what customers paid.
Government policy, including clean hydrogen tax credits and loan guarantees, plays a large role in the economics of hydrogen projects.
Competitive Landscape
Plug competes with fuel cell makers such as Ballard Power, electrolyzer makers such as Nel, ITM Power and Thyssenkrupp Nucera, and industrial gas companies such as Air Products and Linde.
Battery-electric equipment is also a competitor in forklifts and other applications.
Revenue Growth and Financial Performance
When reviewing Plug Power's reported results, these measures give the clearest view of growth, profitability and cash generation:
- Revenue by product line
- Gross margin
- Cash burn and liquidity
- Electrolyzer orders and backlog
- Share count and dilution
Profitability and Earnings Quality
Revenue growth is only part of the picture. For Plug Power, it helps to check whether growth comes from higher volumes, higher prices or acquisitions, and whether margins are widening or narrowing as the business scales.
Reported earnings can include one-time items such as restructuring charges, asset sales, tax effects or legal settlements. Separating these from recurring operating results, and comparing like-for-like periods, gives a more reliable view of underlying profitability.
Balance Sheet, Debt and Financial Stability
A review of Plug Power's financial position starts with cash, total debt, lease obligations and how operating cash flow compares with capital spending. A business that funds its investment from its own cash flow is in a different position from one that relies on borrowing or issuing new shares.
Changes in inventory, receivables and working capital are also worth monitoring, because they can absorb cash and signal shifts in demand before they appear in revenue.
PLUG Stock Valuation Analysis
Measures such as the price-to-earnings ratio, price-to-sales ratio and enterprise value to EBITDA describe how the market is currently pricing Plug Power relative to its results.
However, a single valuation ratio cannot establish whether a stock is undervalued or overvalued. Earnings quality, free cash flow, margins, competitive position and the growth needed to support the current price all need to be considered together, and compared with similar companies.
Business Outlook and Investment Risks
Management guidance and industry conditions shape expectations for Plug Power, but guidance is an estimate rather than an established outcome. Several uncertainties are specific to this business:
- Continued losses and need for additional funding
- Dependence on government incentives
- High cost of hydrogen production and delivery
- Competition and slower-than-expected hydrogen adoption
Hydrogen Production Economics
An electrolyzer uses electricity to split water into hydrogen and oxygen. The economics depend on the electricity consumed for each unit of hydrogen, the price and availability of that electricity, and how much of the equipment's capacity is used. A plant can face a tradeoff between operating when electricity is inexpensive and running often enough to spread fixed costs across a larger output. Water treatment, compression, maintenance and plant staffing also contribute to the delivered cost, even though they receive less attention than the electricity input.
Production cost and delivered cost describe different stages of the supply chain. Hydrogen may need to be compressed or liquefied, stored, loaded and transported before it reaches a customer. Each step requires equipment and energy, and some hydrogen can be lost during handling. The distance between a plant and its customers, the amount delivered per trip and the use of storage assets therefore affect economics. Comparing plant output with customer deliveries can help explain why a production improvement does not necessarily translate directly into a similar improvement in fuel margins.
Contracts And Revenue Recognition
A hydrogen customer relationship can include equipment, installation, fuel and ongoing service. These components may be delivered at different times, so the timing of reported revenue need not match the timing of the original order or the receipt of cash. Financial statement notes on revenue recognition explain how the company identifies its obligations and when it records revenue for each type of arrangement. A contract with several components may also require the company to allocate the transaction price among them, affecting the revenue shown in individual categories.
Contract assets and contract liabilities provide additional context. A contract asset can arise when work has been recognized as revenue before the company has an unconditional right to bill. A contract liability can arise when a customer pays before the related goods or services are delivered. Changes in these balances can reflect the timing of projects and invoices. They should be read alongside the notes and cash flow statement, since a rise or decline alone does not establish whether a contract is profitable or whether a customer relationship is strengthening.
Equipment Service And Lifecycle Costs
A fuel cell installation creates obligations beyond the initial equipment sale. Systems require inspections, replacement parts and repairs over their operating lives, while customers may need fueling infrastructure and technical support. The timing and cost of those activities can differ from the timing of service payments. When assessing service results, it is useful to consider the installed base, equipment usage and the age of systems under coverage. A growing fleet can bring more service activity while also increasing the number of units that may require maintenance.
Warranty provisions offer another view of lifecycle costs. Companies estimate expected warranty claims and record related expenses, then adjust the estimates as experience develops. The financial statement notes can show how the provision changes through new accruals, claims and revisions. A revision may reflect updated assumptions about failure rates, repair costs or coverage, rather than a change in current sales. Comparing the explanation for a revision with service expenses and the age of the installed fleet helps distinguish an accounting estimate from the cash cost of repairs performed in the period.
Reading Project Commitments
Building hydrogen facilities involves commitments that may extend beyond the cash already spent. A company can sign construction, equipment supply, electricity or transportation agreements before a plant begins operating. The notes on commitments and contingencies can help identify the nature and timing of these obligations. Some arrangements set minimum purchase quantities or other terms that require payment even when utilization is low. Those commitments should be considered alongside available liquidity and the expected timing of project completion, rather than inferred solely from the balance sheet totals.
A project can also move through construction, commissioning and commercial operation at different times. Costs incurred during construction may be recorded as assets, while depreciation and operating expenses generally become relevant when an asset is ready for its intended use. Impairment disclosures can explain when management reassesses the carrying amount of an asset and the assumptions involved. These accounting stages help readers interpret changes in spending and expenses, but an asset's carrying value by itself does not show how efficiently the facility operates or how much cash it generates.
Conclusion: Is PLUG Stock Worth Analyzing in 2027?
Plug Power has a business model with clear drivers that can be tracked through its reported results, and a set of risks that are specific to its industry and financial position.
A balanced assessment considers growth, profitability, balance-sheet strength, valuation and risk together. PLUG is a company worth monitoring for what its results reveal about its business.