Company Overview
Micron Technology supplies memory and storage products, including DRAM and NAND, for computing, mobile, data-center, automotive and other applications. Its results are closely linked to demand, industry supply and product mix.
Micron Technology was founded in Boise, Idaho, and grew into one of the world's largest memory chip manufacturers. Through decades of industry consolidation, the DRAM market narrowed to a few major producers, and Micron became the primary US-based company among them.
Micron operates fabrication plants in several countries and invests heavily in new process technology and manufacturing capacity. Its product range covers DRAM, NAND flash and high-bandwidth memory used in data centers, PCs, smartphones, automobiles and industrial equipment.
Fiscal 2026 Results (year ended early September 2026)
Micron reported its fiscal fourth-quarter and full-year 2026 results at the end of September 2026.
Fiscal 2026 revenue was about 3.6 times the prior year, and GAAP operating income reached $99.34 billion. Results of this size reflect how sharply memory pricing and demand can swing within a cycle.
DRAM, including high-bandwidth memory, made up about three quarters of revenue, with NAND at $31.79 billion, or about 24%.
The trailing P/E of about 11 is low partly because trailing earnings rose so quickly. For a cyclical business, a P/E based on peak-cycle earnings is read differently from one based on mid-cycle earnings.
Business Model and Revenue Drivers
Memory markets are cyclical: supply additions, customer inventories and demand can influence pricing and utilization.
Different end markets and product categories have distinct qualification periods, performance requirements and margin profiles.
Capital spending is significant in semiconductor manufacturing, making capacity planning and cash flows important parts of company analysis.
Competitive Landscape
In DRAM, Micron's main competitors are Samsung and SK hynix, which together with Micron account for most global supply. In NAND flash, the field also includes Kioxia, SanDisk, Solidigm and Chinese producers. Competition centers on cost per bit, product performance and the speed of moving to new process nodes.
In high-bandwidth memory, the key competitive factors are qualification with AI accelerator makers, production yields and the ability to ship advanced stacked memory at scale. Because HBM uses more wafer capacity per bit, success in this market also affects supply available for standard DRAM.
Revenue Growth and Financial Performance
When reviewing Micron Technology's reported results, these measures give the clearest view of growth, profitability and cash generation:
- Revenue, gross margin and operating income across reporting periods
- DRAM and NAND pricing, inventories and shipment trends
- Capital expenditure, depreciation and manufacturing utilization
- Free cash flow, cash balances and debt
- Research spending and product mix by end market
Profitability and Earnings Quality
Revenue growth is only part of the picture. For Micron Technology, it helps to check whether growth comes from higher volumes, higher prices or acquisitions, and whether margins are widening or narrowing as the business scales.
Reported earnings can include one-time items such as restructuring charges, asset sales, tax effects or legal settlements. Separating these from recurring operating results, and comparing like-for-like periods, gives a more reliable view of underlying profitability.
Balance Sheet, Debt and Financial Stability
A review of Micron Technology's financial position starts with cash, total debt, lease obligations and how operating cash flow compares with capital spending. A business that funds its investment from its own cash flow is in a different position from one that relies on borrowing or issuing new shares.
Changes in inventory, receivables and working capital are also worth monitoring, because they can absorb cash and signal shifts in demand before they appear in revenue.
MU Stock Valuation Analysis
Measures such as the price-to-earnings ratio, price-to-sales ratio and enterprise value to EBITDA describe how the market is currently pricing Micron Technology relative to its results.
However, a single valuation ratio cannot establish whether a stock is undervalued or overvalued. Earnings quality, free cash flow, margins, competitive position and the growth needed to support the current price all need to be considered together, and compared with similar companies.
Business Outlook and Investment Risks
Management guidance and industry conditions shape expectations for Micron Technology, but guidance is an estimate rather than an established outcome. Several uncertainties are specific to this business:
- Sharp swings in memory prices and supply-demand balance
- High fixed costs and capital requirements during down cycles
- Competition and ongoing investment required for new technologies
- Trade restrictions, supply-chain disruptions and customer concentration
From Wafers To Usable Memory
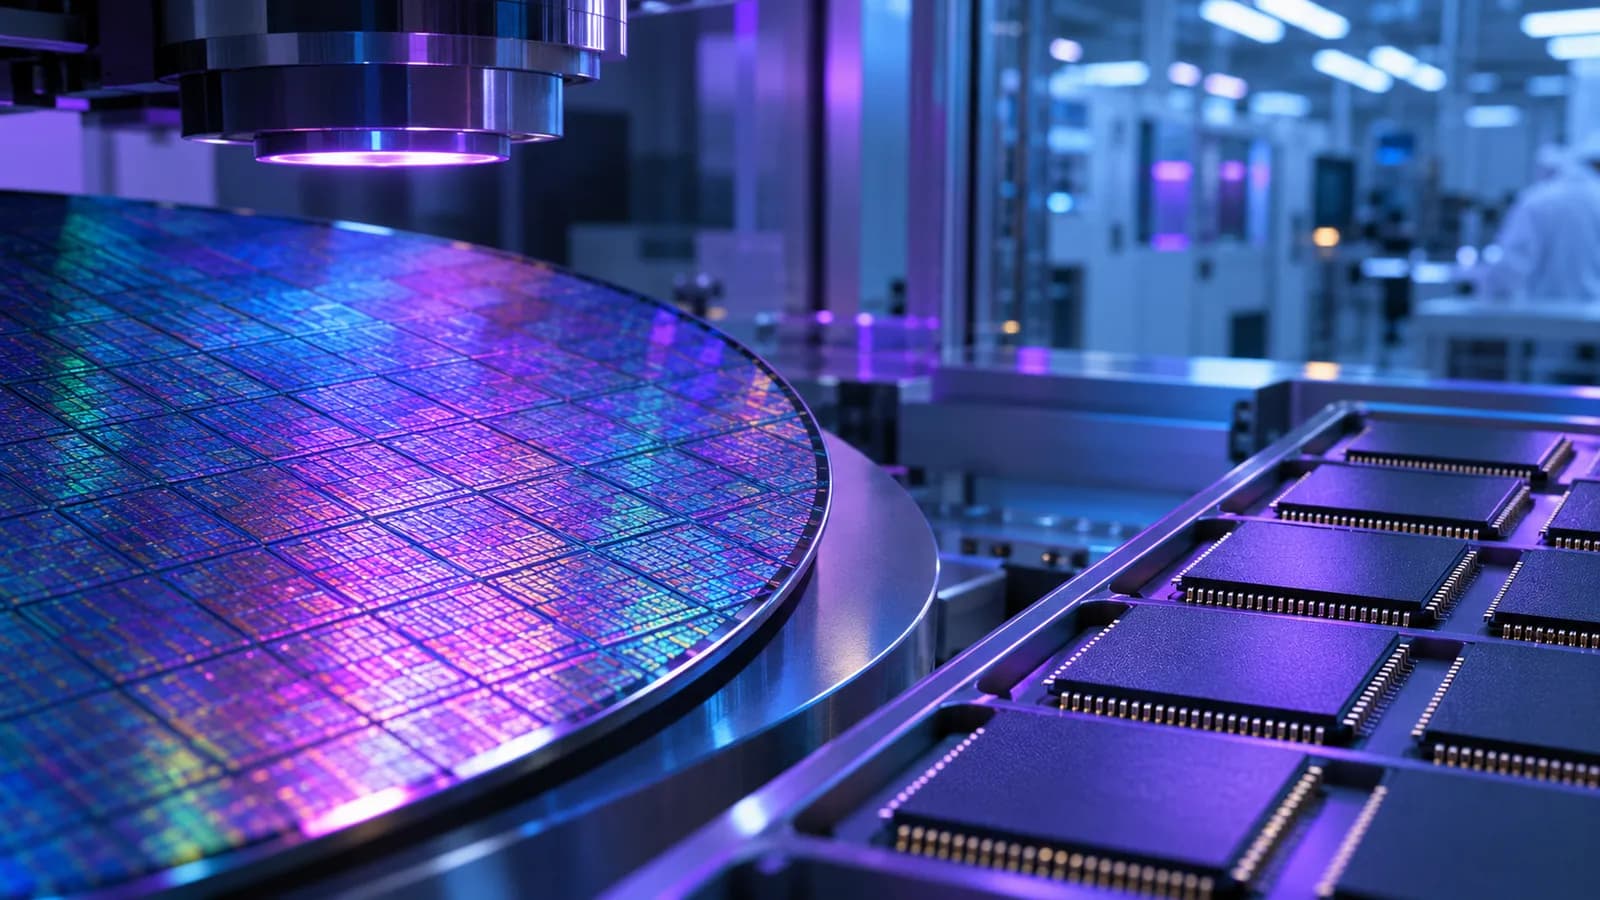
A memory fabrication plant processes silicon wafers through many layers of deposition, patterning and etching. Each wafer contains numerous potential chips, but not every chip meets the required specifications. Yield describes the share that can be used for a particular purpose. Improving yield spreads manufacturing costs across more usable output, while defects or a difficult technology transition can raise the cost of each usable chip even if the number of wafers processed stays unchanged.
After fabrication, chips are tested, packaged and sometimes combined into modules or storage products. Testing can sort devices by their operating characteristics, so the same production process can support products with different specifications. Packaging and assembly add their own costs and constraints. Examining manufacturing performance therefore means considering the whole path from wafer starts to finished, qualified products, rather than treating a factory's nominal capacity as equivalent to saleable output.
Contracts And Customer Qualification
Memory reaches customers through different commercial arrangements. Some customers purchase components for assembly into their own products, while others buy modules or finished drives. Agreements can differ in duration, delivery schedules and the degree to which quantities and prices are fixed. Reported revenue combines these arrangements, so a change in the company's overall average selling price does not necessarily describe the experience of every customer or product line.
Before a component enters a customer's design, it may undergo testing for compatibility, reliability and performance. Once approved, a component can become part of a validated system configuration, making substitutions a technical as well as a purchasing decision. Qualification does not guarantee a particular order volume, however. A customer can adjust production plans or qualify more than one supplier, while a new design may require another round of testing.
Reading Inventory Accounting
Inventory on a memory manufacturer's balance sheet includes materials, partly completed wafers and finished goods. Its recorded value reflects accumulated production costs, not simply the number of chips in storage. When assessing a change in the inventory balance, it helps to distinguish a change in physical quantities from a change in unit costs or the composition of products at different stages of production.
Accounting rules can require inventory to be written down when its recorded cost exceeds the amount expected to be recovered through sale. Such a charge affects reported gross profit in the period recognized. If products previously written down are later sold, their reduced carrying cost can affect the gross profit recognized on those sales. Notes to the financial statements can help explain these effects and make comparisons between periods more meaningful.
Depreciation And Factory Economics
A fabrication facility and its equipment provide services over multiple accounting periods. Rather than charging the full purchase cost to earnings immediately, a company generally allocates that cost over the assets' estimated useful lives through depreciation. Some manufacturing depreciation enters inventory costs before reaching cost of goods sold. Consequently, the timing of a cash payment for equipment can differ substantially from the timing of its effect on reported profit.
Changes in estimated useful lives or the retirement of equipment can affect depreciation expense and make margins harder to compare across periods. Cash flow statements show purchases of property and equipment, while financial statement notes provide context on depreciation methods and asset categories. Reading these disclosures together helps distinguish spending on assets from the accounting expense associated with assets already in service.
Conclusion: Is MU Stock Worth Analyzing in 2027?
Micron Technology has a business model with clear drivers that can be tracked through its reported results, and a set of risks that are specific to its industry and financial position.
A balanced assessment considers growth, profitability, balance-sheet strength, valuation and risk together. MU is a company worth monitoring for what its results reveal about its business.