Company Overview
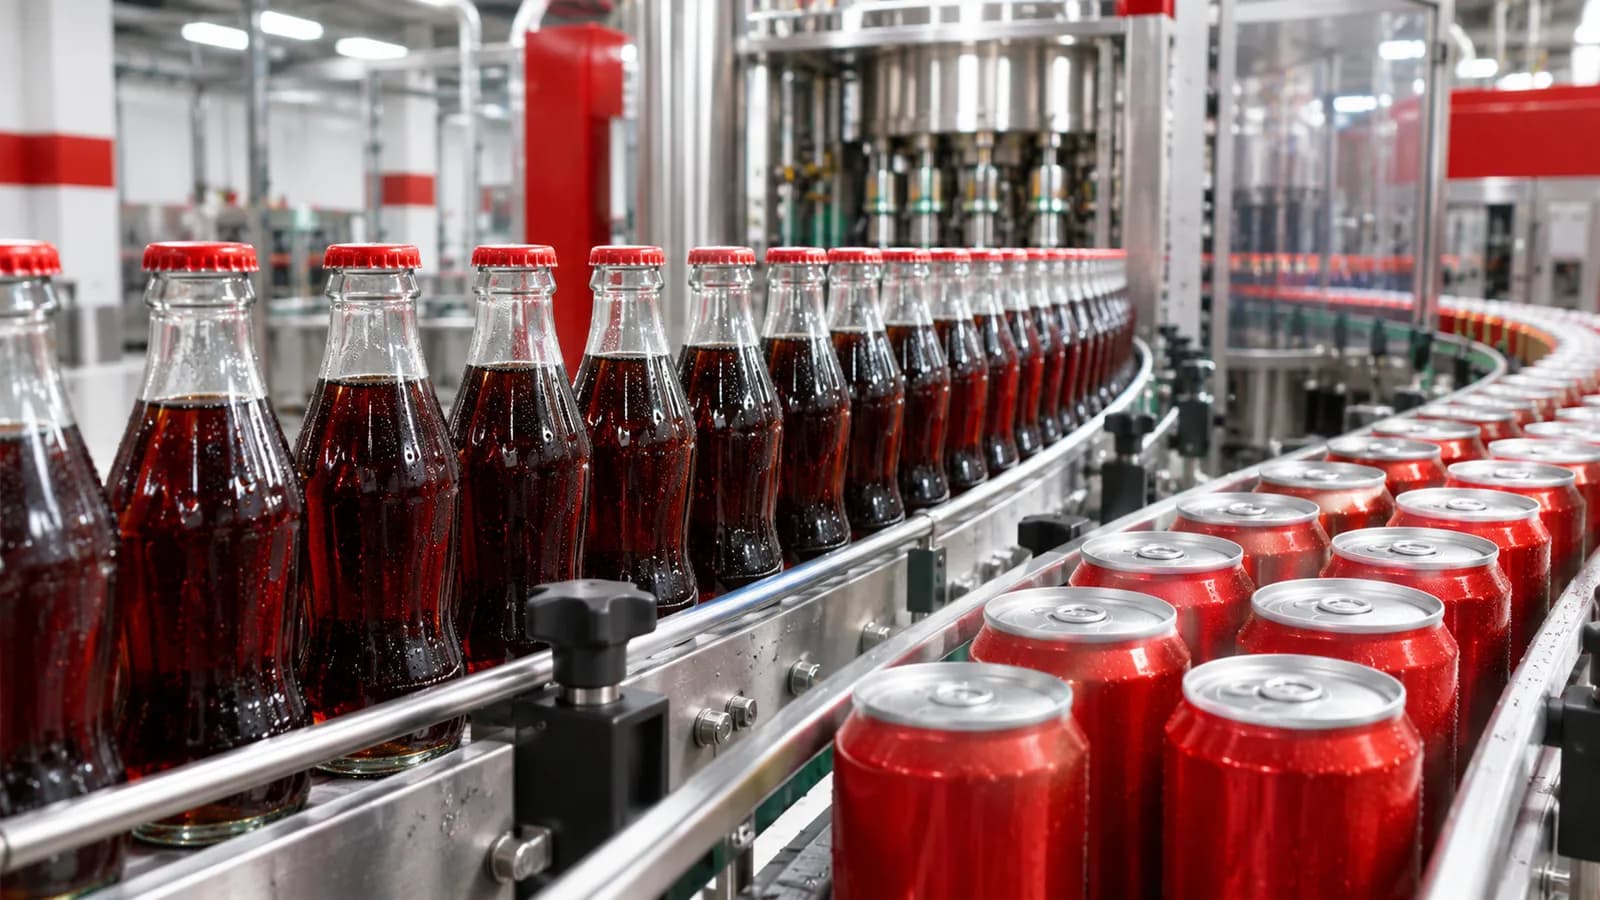
The Coca-Cola Company owns soft drink, juice, water, coffee, tea and sports drink brands sold in more than 200 countries. It trades on the NYSE under the ticker KO. Most of its business involves selling concentrate to independent bottling partners, which produce and distribute the finished drinks.
Coca-Cola was invented in Atlanta in 1886 and grew into one of the world's best-known brands.
The company refranchised many bottling operations to focus on brands and concentrate.
Latest Quarterly Results: Q3 2026
Coca-Cola reported third-quarter 2026 results on October 27, 2026.
Growth this quarter came mainly from higher volumes rather than price. Latin America was the strongest region, while North America volume was flat.
Business Model and Revenue Drivers
The concentrate model requires relatively little capital and supports high margins, while bottlers handle manufacturing and distribution.
Organic revenue growth is split into price and mix, which reflects pricing and product mix, and concentrate sales, which reflect volume.
Coca-Cola has a long history of increasing its dividend.
Competitive Landscape
Coca-Cola competes with PepsiCo, Keurig Dr Pepper, Monster and many local brands.
Its brand portfolio and global distribution system are key strengths.
Revenue Growth and Financial Performance
When reviewing Coca-Cola's reported results, these measures give the clearest view of growth, profitability and cash generation:
- Organic revenue growth
- Unit case volume
- Price and mix
- Operating margin
- Dividend and free cash flow
Profitability and Earnings Quality
Revenue growth is only part of the picture. For Coca-Cola, it helps to check whether growth comes from higher volumes, higher prices or acquisitions, and whether margins are widening or narrowing as the business scales.
Reported earnings can include one-time items such as restructuring charges, asset sales, tax effects or legal settlements. Separating these from recurring operating results, and comparing like-for-like periods, gives a more reliable view of underlying profitability.
Balance Sheet, Debt and Financial Stability
A review of Coca-Cola's financial position starts with cash, total debt, lease obligations and how operating cash flow compares with capital spending. A business that funds its investment from its own cash flow is in a different position from one that relies on borrowing or issuing new shares.
Changes in inventory, receivables and working capital are also worth monitoring, because they can absorb cash and signal shifts in demand before they appear in revenue.
KO Stock Valuation Analysis
Measures such as the price-to-earnings ratio, price-to-sales ratio and enterprise value to EBITDA describe how the market is currently pricing Coca-Cola relative to its results.
However, a single valuation ratio cannot establish whether a stock is undervalued or overvalued. Earnings quality, free cash flow, margins, competitive position and the growth needed to support the current price all need to be considered together, and compared with similar companies.
Business Outlook and Investment Risks
Management guidance and industry conditions shape expectations for Coca-Cola, but guidance is an estimate rather than an established outcome. Several uncertainties are specific to this business:
- Currency movements
- Consumer shifts away from sugary drinks
- Regulation and sugar taxes
- Commodity costs
The Bottling System In Practice
A concentrate transaction is one stage in a longer chain. Bottlers combine beverage bases with other ingredients, package the finished drinks and arrange delivery to stores, restaurants and other outlets. The company and its bottling partners have distinct financial statements and cost structures, even though consumers encounter a single branded product. Reading the company's results therefore does not provide a complete account of the revenue or expenses generated across the whole system.
The relationship between the company and a bottler is governed by agreements covering matters such as territory, authorized products and commercial responsibilities. The partners must coordinate production capacity, packaging choices, marketing and distribution while managing their own economics. A change that helps one participant can affect the other differently. For example, a new package may help a retailer use shelf space differently while requiring a bottler to adjust its production lines and delivery arrangements.
Sales to bottlers and sales of finished beverages to consumers occur at different points in the supply chain. Bottlers may change their ordering patterns as they manage stocks of concentrate or prepare for promotions. Consequently, concentrate shipments can move differently from finished beverage volume in a particular reporting period. Comparing the measures over several periods and reading management's explanation can help distinguish timing effects from changes in underlying consumption.
Retail channels also shape how beverages reach consumers. Supermarkets, convenience stores, restaurants and vending operators differ in package sizes, service needs and purchasing occasions. Fountain drinks involve equipment and syrup supplied to food service customers, while packaged drinks require containers and physical shelf space. These channels can have different costs and economics for the company and its partners, so a shift in where drinks are sold can affect results even when total consumption changes little.
Reading Segment And Currency Results
The company's geographic segment disclosures help explain how operations in different markets contribute to consolidated results. Start by comparing each segment's revenue and operating income, then read the notes on changes in the scope of operations. Segment accounting reflects the activities included in each reporting unit, so a segment that includes more finished product operations is not directly comparable on margin with one that relies more heavily on concentrate sales.
Currency translation is separate from the underlying number of drinks sold. Revenue earned in a local currency must be converted into US dollars for consolidated reporting, and exchange rate changes can alter the dollar amount even when local currency sales are unchanged. The same translation process affects expenses and operating income. Company disclosures that distinguish currency effects from other changes help explain why reported growth and growth measured without translation can differ.
Foreign exchange can also affect operations before translation. A local business may receive revenue in one currency while buying ingredients, packaging or equipment priced in another. The effect depends on contracts, sourcing and any hedging arrangements. Financial statement notes can clarify the nature of currency exposures and derivatives, but a hedge should be understood in relation to the particular cash flow or balance sheet item it is intended to offset.
Acquisitions and disposals can change the boundaries of a segment between comparison periods. A business sold during a period may contribute revenue for only part of it, while a newly acquired business can add sales that were absent from the earlier period. Refranchising can similarly change the activities recorded in consolidated statements. Examining transaction descriptions alongside segment results helps separate changes in business scope from changes in the operations retained.
Brand Investment And Intangible Assets
Brand building involves spending across advertising, packaging design, sponsorships and relationships with retailers and food service operators. Some spending supports individual products, while other activity promotes a broader portfolio or a particular consumption occasion. The timing of these costs need not match the timing of the sales they support. Comparing marketing expenses across periods therefore requires attention to campaigns, accounting classifications and changes in the businesses included in the accounts.
A familiar brand's economic importance is not necessarily shown as an equivalent asset on the balance sheet. Accounting generally treats many internally generated brand building costs as expenses when incurred, while identifiable brands acquired in a transaction can be recognized as intangible assets. This distinction means that balance sheet values reflect accounting history as well as commercial activity. Two similar brands can appear differently in the accounts because one was developed internally and the other was purchased.
Acquired intangible assets require attention to their useful lives and subsequent accounting. Assets with finite useful lives are generally amortized over those lives, creating an expense that reduces reported income without a corresponding cash payment in each period. Certain indefinite lived intangibles are tested for impairment rather than amortized. An impairment charge reflects a reduction in a recorded asset's carrying value under accounting rules and can make reported earnings less comparable across periods.
Goodwill is distinct from an identified trademark or other separately recognized intangible asset. It arises in an acquisition when the purchase price exceeds the recognized net identifiable assets acquired, subject to the applicable accounting treatment. Goodwill is tested for impairment, and a charge can indicate that the recorded value of an acquired business has fallen under the relevant accounting test. The acquisition notes and impairment disclosures provide context for interpreting such a charge.
Conclusion: Is KO Stock Worth Analyzing in 2027?
Coca-Cola has a business model with clear drivers that can be tracked through its reported results, and a set of risks that are specific to its industry and financial position.
A balanced assessment considers growth, profitability, balance-sheet strength, valuation and risk together. KO is a company worth monitoring for what its results reveal about its business.