Company Overview
Credo Technology designs high-speed connectivity products, including active electrical cables (AECs), SerDes chips and optical digital signal processors, used to move data between servers and switches. It trades on Nasdaq under the ticker CRDO.
Credo Technology was founded in 2008 and specializes in high-speed serial connectivity.
It became public in 2022.
Latest Quarterly Results: Fiscal Q1 2027
Credo reported fiscal first-quarter 2027 results (quarter ended August 1, 2026) on September 1, 2026.
Active electrical cables remained the main growth driver, and the company expects optical products to contribute more in the second half of its fiscal year.
With roughly 84% of revenue from four customers, changes in any one large customer's purchasing can have a large effect on quarterly results.
Business Model and Revenue Drivers
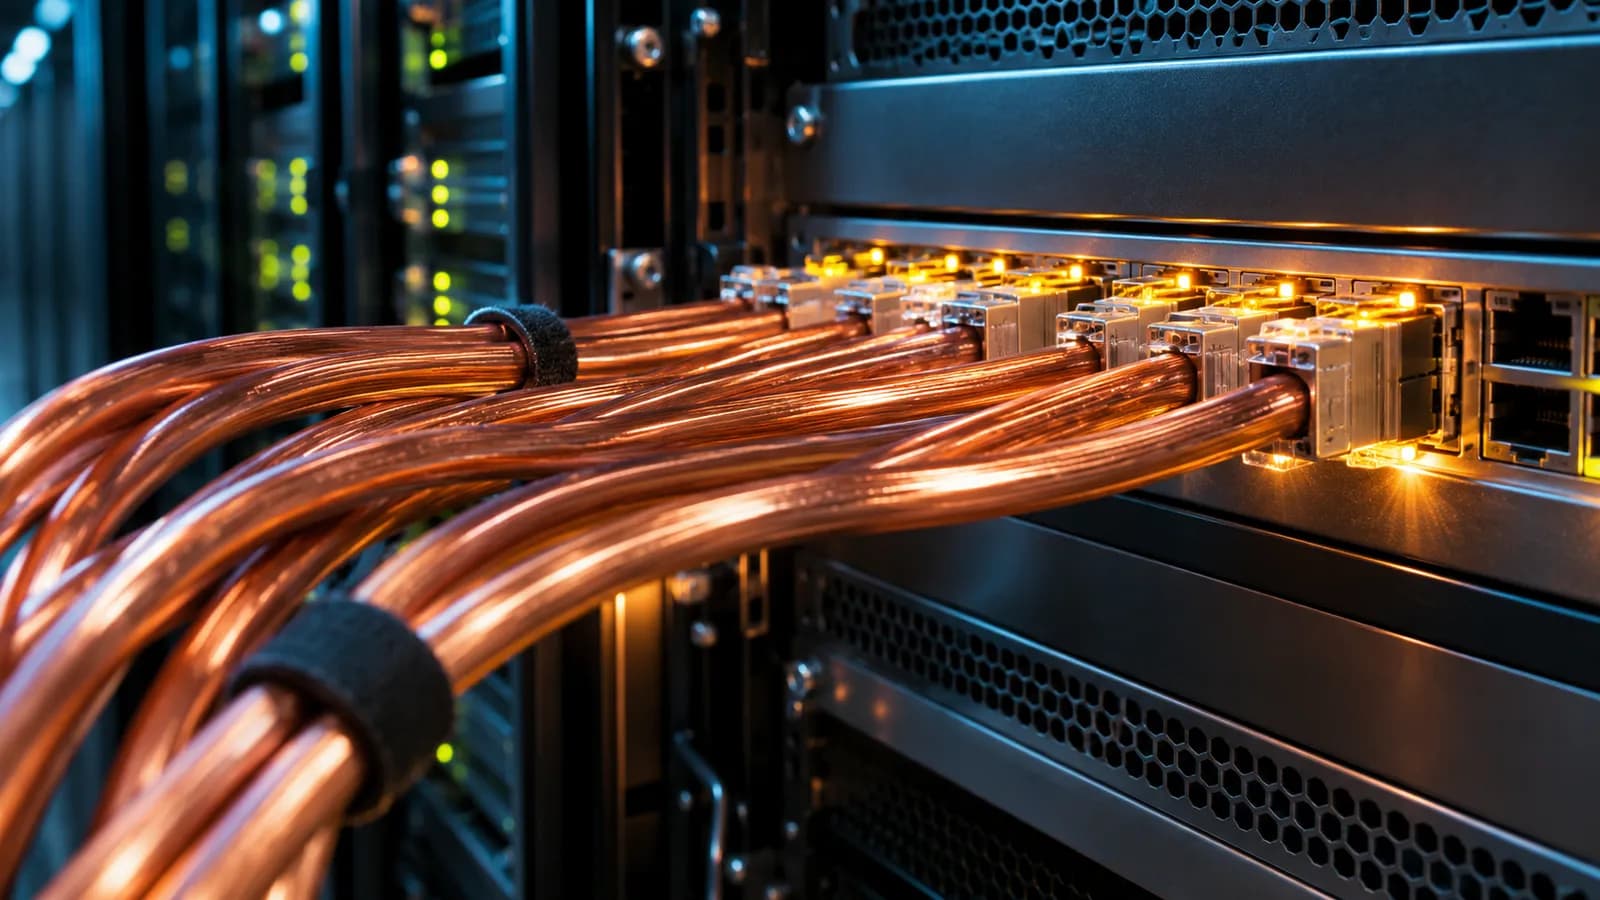
Active electrical cables connect servers and switches inside AI clusters and are an alternative to optical connections over short distances.
Credo's revenue is concentrated among a small number of large cloud customers.
The company is fabless and relies on contract manufacturers.
Competitive Landscape
Credo competes with Broadcom, Marvell, Astera Labs and others.
Its active electrical cables are a key differentiator.
Revenue Growth and Financial Performance
When reviewing Credo Technology's reported results, these measures give the clearest view of growth, profitability and cash generation:
- Revenue growth
- Gross margin
- Customer concentration
- Operating margin
- Guidance
Profitability and Earnings Quality
Revenue growth is only part of the picture. For Credo Technology, it helps to check whether growth comes from higher volumes, higher prices or acquisitions, and whether margins are widening or narrowing as the business scales.
Reported earnings can include one-time items such as restructuring charges, asset sales, tax effects or legal settlements. Separating these from recurring operating results, and comparing like-for-like periods, gives a more reliable view of underlying profitability.
Balance Sheet, Debt and Financial Stability
A review of Credo Technology's financial position starts with cash, total debt, lease obligations and how operating cash flow compares with capital spending. A business that funds its investment from its own cash flow is in a different position from one that relies on borrowing or issuing new shares.
Changes in inventory, receivables and working capital are also worth monitoring, because they can absorb cash and signal shifts in demand before they appear in revenue.
CRDO Stock Valuation Analysis
Measures such as the price-to-earnings ratio, price-to-sales ratio and enterprise value to EBITDA describe how the market is currently pricing Credo Technology relative to its results.
However, a single valuation ratio cannot establish whether a stock is undervalued or overvalued. Earnings quality, free cash flow, margins, competitive position and the growth needed to support the current price all need to be considered together, and compared with similar companies.
Business Outlook and Investment Risks
Management guidance and industry conditions shape expectations for Credo Technology, but guidance is an estimate rather than an established outcome. Several uncertainties are specific to this business:
- Dependence on a few large customers
- Competition from Broadcom, Marvell and others
- Technology shifts between copper and optical
- Supply chain constraints
Inside A Data Center Link
A data center link is a system rather than a single component. A signal travels from a transmitting device through a physical connection to a receiving device, and each part must preserve enough information for the receiver to interpret it correctly. Electrical noise, signal loss and interference become more consequential as data rates rise. Connectivity suppliers address these effects through circuit design, signal processing and careful management of power and heat across the complete link.
The useful distinction between a cable assembly and a chip is where the functionality sits. A cable assembly combines connectors, copper conductors and active electronics into a product that can be installed between ports. A standalone connectivity chip can instead be incorporated into equipment or another assembly. These forms can serve different design needs, so a change in product mix can reflect customers choosing different ways to build a network, not simply a change in the number of connections.
From Design To Deployment
A connectivity product must work with the equipment at both ends of a link. Before a broad deployment, a customer may evaluate signal integrity, power consumption, thermal behavior and compatibility with its network hardware. The supplier may also need to demonstrate that products from different manufacturing batches perform consistently. This qualification process can require cooperation among the component supplier, equipment makers and the operator, making technical support part of the commercial relationship.
A design win identifies a product selected for a customer system, but it is not the same thing as recognized revenue. The timing and scale of shipments depend on customer deployment schedules, system configurations and procurement decisions. A reader can distinguish evidence of technical adoption from financial performance by looking for disclosures about qualification, production shipments and revenue recognition. Those stages describe different points in the path from engineering work to reported sales.
Reading Product Economics
Gross margin measures revenue left after the direct costs of products sold. For a connectivity supplier, those costs can include purchased semiconductor wafers, packaging, testing and assembly, as well as other costs associated with delivering products. Different products can carry different manufacturing and support requirements. As a result, an overall margin change may reflect a shift in the composition of shipments as well as changes in the economics of individual products.
Operating expenses capture important activities beyond production, including research and development, sales and administration. Comparing these expenses with revenue helps show how much of gross profit remains to support operating income. Research spending is particularly relevant for a company whose products depend on high speed circuit design and software. A rise in that expense can reflect engineering activity, while the income statement alone does not establish which projects will become commercial products.
Interpreting Cash And Share Counts
Net income and operating cash flow answer different questions. Net income follows accounting rules for recognizing revenue and expenses, while operating cash flow adjusts for noncash items and changes in operating assets and liabilities. Stock-based compensation, for example, is an expense in earnings but does not require the same immediate cash payment as wages. Its addition in the cash flow reconciliation therefore should be read alongside its effect on the number of shares outstanding.
Diluted earnings per share accounts for potential shares under applicable accounting rules, while the share count itself can change as awards vest or options are exercised. Comparing basic and diluted share counts over time adds context to per-share results. Cash generated by operations can also differ from cash available after purchases of property and equipment; the cash flow statement provides the components needed to calculate that difference and understand how the company funds its activities.
Conclusion: Is CRDO Stock Worth Analyzing in 2027?
Credo Technology has a business model with clear drivers that can be tracked through its reported results, and a set of risks that are specific to its industry and financial position.
A balanced assessment considers growth, profitability, balance-sheet strength, valuation and risk together. CRDO is a company worth monitoring for what its results reveal about its business.