Company Overview
Advanced Micro Devices (AMD) designs processors and graphics chips for data centers, PCs, gaming consoles and embedded systems. It trades on Nasdaq under the ticker AMD.
AMD was founded in 1969.
It acquired ATI in 2006 and Xilinx in 2022.
Latest Quarterly Results: Q3 2026
AMD reported third-quarter 2026 results on November 3, 2026.
Data Center now makes up about 64% of AMD's revenue. GAAP net income included a $1.1 billion change in the fair value of customer warrant liabilities, which affects comparisons with operating results.
Business Model and Revenue Drivers
EPYC server CPUs have gained share in data centers.
Instinct GPUs compete in AI accelerators.
AMD acquired Xilinx, adding adaptive computing chips.
Competitive Landscape
AMD competes with Intel, Nvidia, Arm-based chips and others.
Its CPU and GPU portfolio is a strength.
Revenue Growth and Financial Performance
When reviewing AMD's reported results, these measures give the clearest view of growth, profitability and cash generation:
- Data center revenue
- Client revenue
- Gross margin
- AI GPU revenue
- Free cash flow
Profitability and Earnings Quality
Revenue growth is only part of the picture. For AMD, it helps to check whether growth comes from higher volumes, higher prices or acquisitions, and whether margins are widening or narrowing as the business scales.
Reported earnings can include one-time items such as restructuring charges, asset sales, tax effects or legal settlements. Separating these from recurring operating results, and comparing like-for-like periods, gives a more reliable view of underlying profitability.
Balance Sheet, Debt and Financial Stability
A review of AMD's financial position starts with cash, total debt, lease obligations and how operating cash flow compares with capital spending. A business that funds its investment from its own cash flow is in a different position from one that relies on borrowing or issuing new shares.
Changes in inventory, receivables and working capital are also worth monitoring, because they can absorb cash and signal shifts in demand before they appear in revenue.
AMD Stock Valuation Analysis
Measures such as the price-to-earnings ratio, price-to-sales ratio and enterprise value to EBITDA describe how the market is currently pricing AMD relative to its results.
However, a single valuation ratio cannot establish whether a stock is undervalued or overvalued. Earnings quality, free cash flow, margins, competitive position and the growth needed to support the current price all need to be considered together, and compared with similar companies.
Business Outlook and Investment Risks
Management guidance and industry conditions shape expectations for AMD, but guidance is an estimate rather than an established outcome. Several uncertainties are specific to this business:
- Competition from Nvidia and Intel
- Export restrictions
- Dependence on TSMC
- PC and gaming cycles
From Chip Design To Delivery
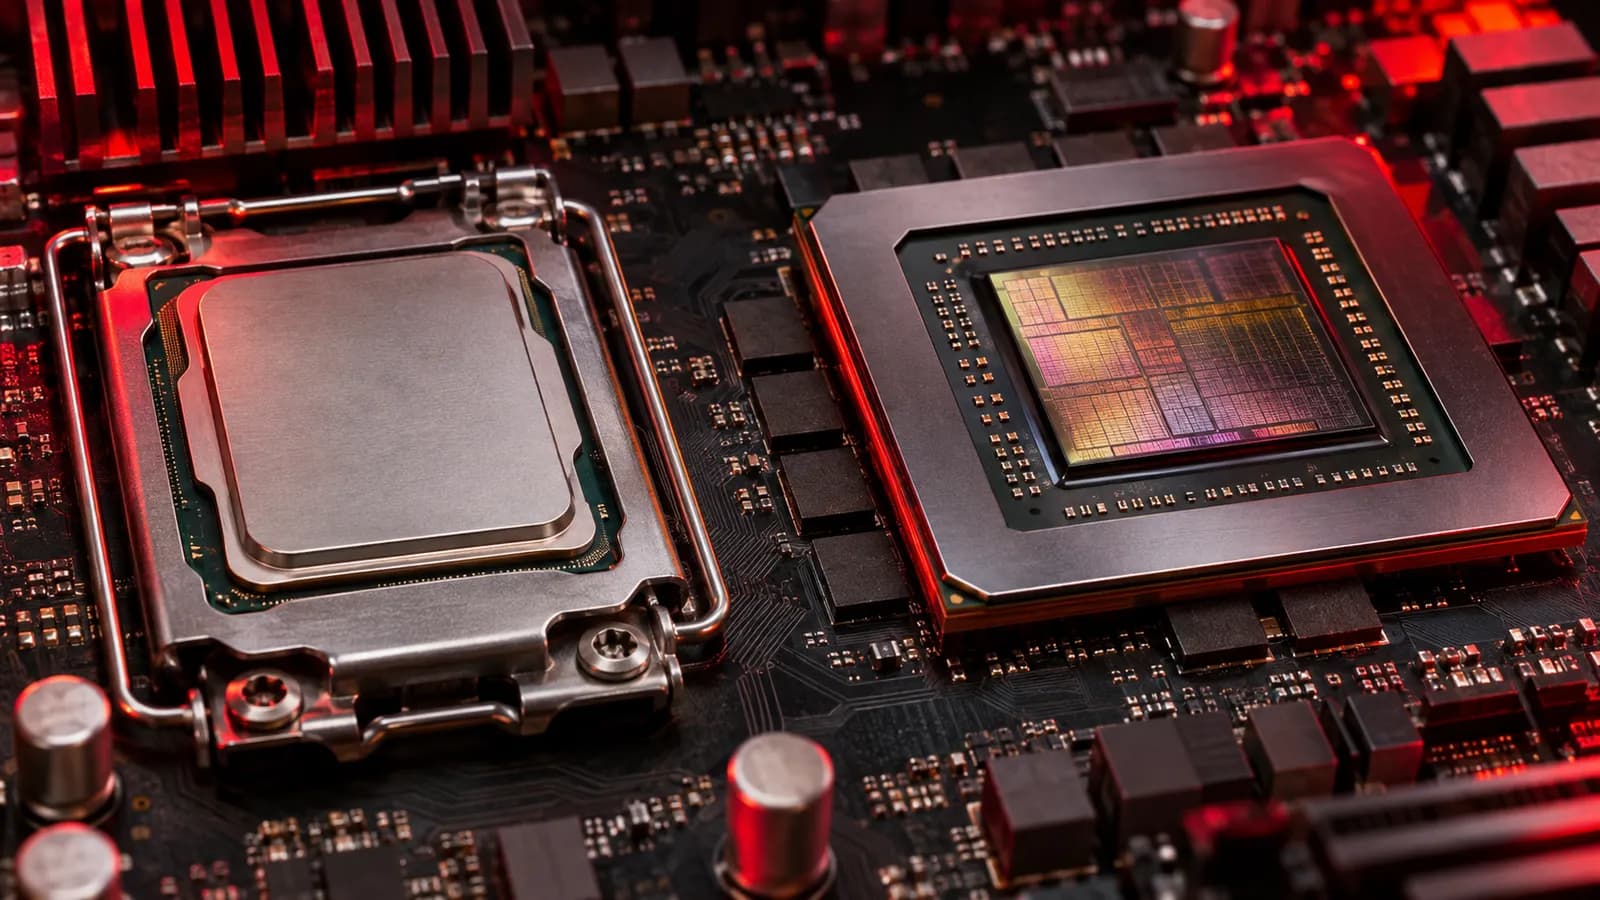
AMD operates as a fabless semiconductor company: it designs chips and relies on outside manufacturers to fabricate them. A design must be translated into manufacturing instructions, produced on silicon wafers, tested, packaged and delivered through a supply chain. Each stage has its own capacity and technical requirements. A successful design therefore depends on coordination among foundries, packaging providers, equipment suppliers and customers, as well as on the performance of the chip itself.
Manufacturing yield describes the proportion of usable chips produced from a wafer. Complex designs can be affected by defects, while advanced packaging can add further production steps. AMD also uses chiplets, combining smaller pieces of silicon in a package to create a processor. This approach gives designers flexibility in combining functions and manufacturing technologies, but it makes connections between components and packaging execution important parts of the final product.
The time between committing to production and delivering a finished chip can be substantial. Manufacturing arrangements therefore require planning around component availability and customer requirements. Different products may also compete for access to specialized manufacturing or packaging capacity. When examining cost of sales, it is useful to remember that it reflects more than the raw silicon: production, testing and packaging all contribute to the cost of delivering a finished product.
How Products Reach Customers
AMD reaches end users through several routes. Server manufacturers and cloud providers incorporate processors into systems, while PC manufacturers select components for particular laptop and desktop designs. Graphics cards can reach customers through board partners and retailers. In each case, a component sale is tied to a wider product that needs engineering, testing and distribution. The timing of a system launch or a customer's purchasing schedule can therefore affect when AMD records sales.
Console processors illustrate a different relationship from selling a standard PC processor. A console maker works with AMD on a custom chip for a particular platform, and production is linked to that platform's manufacturing requirements. Such arrangements can involve long development periods and product cycles. Revenue from the chip does not capture the retail price of the finished console, which also includes other components, assembly, distribution and the console maker's own economics.
Embedded products often serve equipment that remains in use for many years. Customers may qualify a device for a specific design and maintain software around it, making product availability and continuity relevant alongside performance. Adaptive devices can be configured for different tasks, allowing a customer to tailor hardware behavior to an application. These characteristics distinguish embedded purchasing decisions from consumer upgrades, although individual projects and ordering patterns can still vary.
Software And System Adoption
A processor's specifications are only one part of its usefulness. Operating systems, compilers, libraries and applications must work with the hardware, and developers need tools to build and maintain their software. For data center accelerators, moving an existing workload can require code changes, testing and staff training. AMD's ROCm software platform provides tools and libraries for compatible accelerator workloads, making software support an important part of how customers assess the complete system.
Compatibility also matters for server CPUs. AMD's x86 processors use an instruction set supported by a broad range of existing software, but a customer still needs to validate applications, security settings and system configurations. Comparing processors on a single benchmark can miss differences in memory capacity, networking, power use and workload behavior. A useful analysis considers the performance of the entire system under the customer's actual operating conditions.
Large computing installations also depend on physical infrastructure. Accelerators and processors require power delivery, cooling, network connections and space in servers or racks. System designers must balance these constraints with memory capacity and data movement between chips. A faster component does not automatically make every application faster if another part of the system limits throughput. These relationships help explain why customers evaluate hardware and software together before deploying a new configuration.
Reading Operating Costs And Segment Results
Research and development spending covers work such as chip architecture, software and product engineering. Selling, general and administrative expenses support activities such as sales and corporate operations. Reviewing these costs alongside revenue can show how spending relates to the scale of the business. However, development costs in a reporting period may support products across several generations, so a simple comparison with current sales does not measure the contribution of a particular project.
Segment operating income adds context to segment revenue by showing results after expenses allocated under the company's reporting framework. The segment note and management's discussion explain which activities are included and how management evaluates them. Corporate costs and other items may be reported outside segment results, so adding segment figures without checking the reconciliation can give an incomplete picture of company-wide operating income. Changes in product mix within a segment can also affect its reported profitability.
Acquisitions can leave intangible assets on the balance sheet, including acquired technology and customer relationships. Amortization allocates the recorded cost of certain assets over their useful lives and appears as an expense under accounting rules. Stock-based compensation is another expense that can differ between GAAP and adjusted measures. Reading the reconciliation between those measures shows which costs management excludes and helps explain why the resulting earnings figures differ.
The statement of cash flows can also clarify the relationship between accounting expenses and cash movements. It starts with net income and adjusts for noncash items and changes in operating assets and liabilities. For example, depreciation and amortization reduce accounting income but are added back in the operating cash flow reconciliation. The investing section separately records cash used for purchases of property and equipment, making the timing of spending visible alongside the accounting expense.
Conclusion: Is AMD Stock Worth Analyzing in 2027?
AMD has a business model with clear drivers that can be tracked through its reported results, and a set of risks that are specific to its industry and financial position.
A balanced assessment considers growth, profitability, balance-sheet strength, valuation and risk together. AMD is a company worth monitoring for what its results reveal about its business.