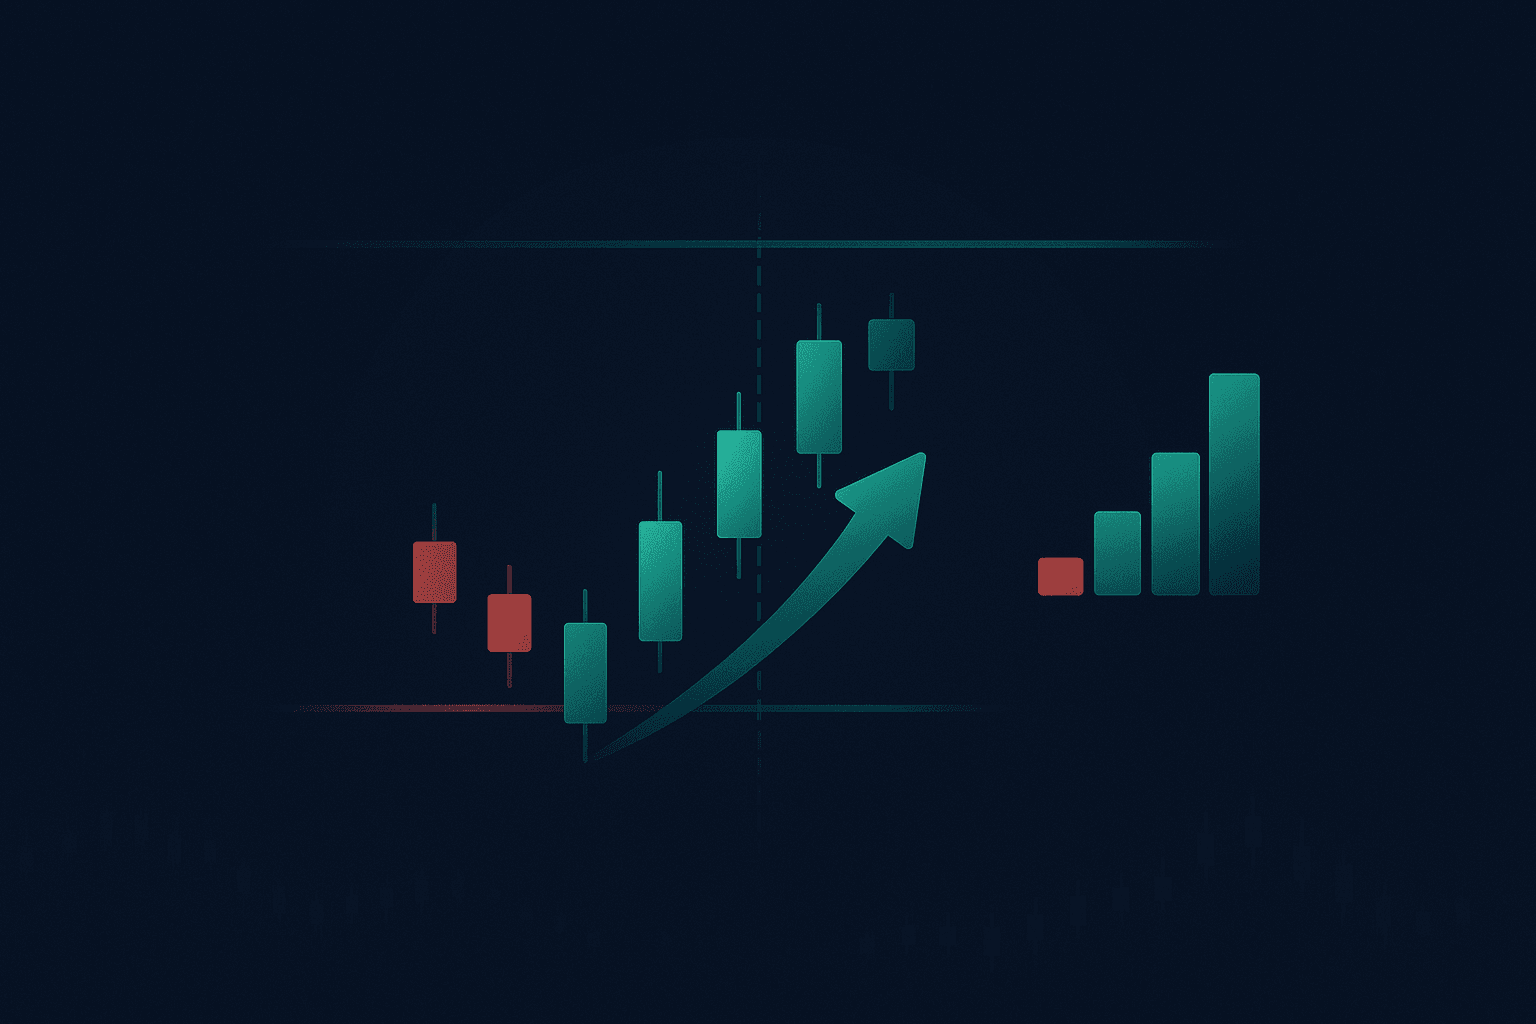
Drawdown & Capital Recovery Calculator
Calculate how much percentage gain is required to recover from drawdowns. Understand the non-linear damage of losses and why risk must shrink after drawdowns.
Drawdown Parameters
Recovery Requirements Curve
Shows how recovery requirements grow exponentially with larger drawdowns
Capital Recovery Analysis
Key Lesson: A 20.00% drawdown requires a 25.00% gain just to break even.
Risk Implication: After this drawdown, your position sizes should be reduced to maintain consistent risk levels, as the same dollar risk now represents a larger percentage of your smaller capital base.
Recommended Action: Consider reducing position sizes by approximately 20.00% to maintain equivalent risk exposure.
Drawdown & Capital Recovery Calculator FAQ
What is a Drawdown?
A drawdown is the peak-to-trough decline in the value of your investment or trading account. It represents the maximum loss from a peak to the lowest point before recovery.
Why is Capital Recovery Important?
Capital recovery shows how much you need to gain just to get back to breakeven after a loss. For example, a 50% loss requires a 100% gain to recover. This demonstrates the asymmetric nature of losses and gains.
What is the Recovery Formula?
The formula to calculate recovery percentage is: Recovery % = (Drawdown % / (1 - Drawdown %)) × 100. This shows the non-linear relationship between losses and required gains for recovery.
Why Must Risk Shrink After Drawdowns?
After a drawdown, your remaining capital is smaller, so the same absolute risk now represents a larger percentage of your portfolio. To maintain consistent risk levels, you must reduce position sizes.
What is Maximum Drawdown?
Maximum drawdown is the largest peak-to-trough decline in your account value over a specific period. It's a key metric for assessing the risk of investment strategies and trading systems.
How to Manage Drawdowns?
Use position sizing that limits drawdowns to acceptable levels (typically 10-20%), implement stop-losses, diversify your portfolio, and reduce risk after experiencing drawdowns to protect remaining capital.
Trade gold with discipline, not emotion
Get real-time entries, exits, and risk levels with daily context and timing.
Talk to our team
Product & Subscription Inquiries
For pricing, enterprise access, or integration questions, reach us directly.
Business hours: 09:00–18:00 IST · Enterprise SLAs available on request.