Abnormal Returns
Author: Shashi Prakash Agarwal
Meaning, Importance, Differences, and Calculation
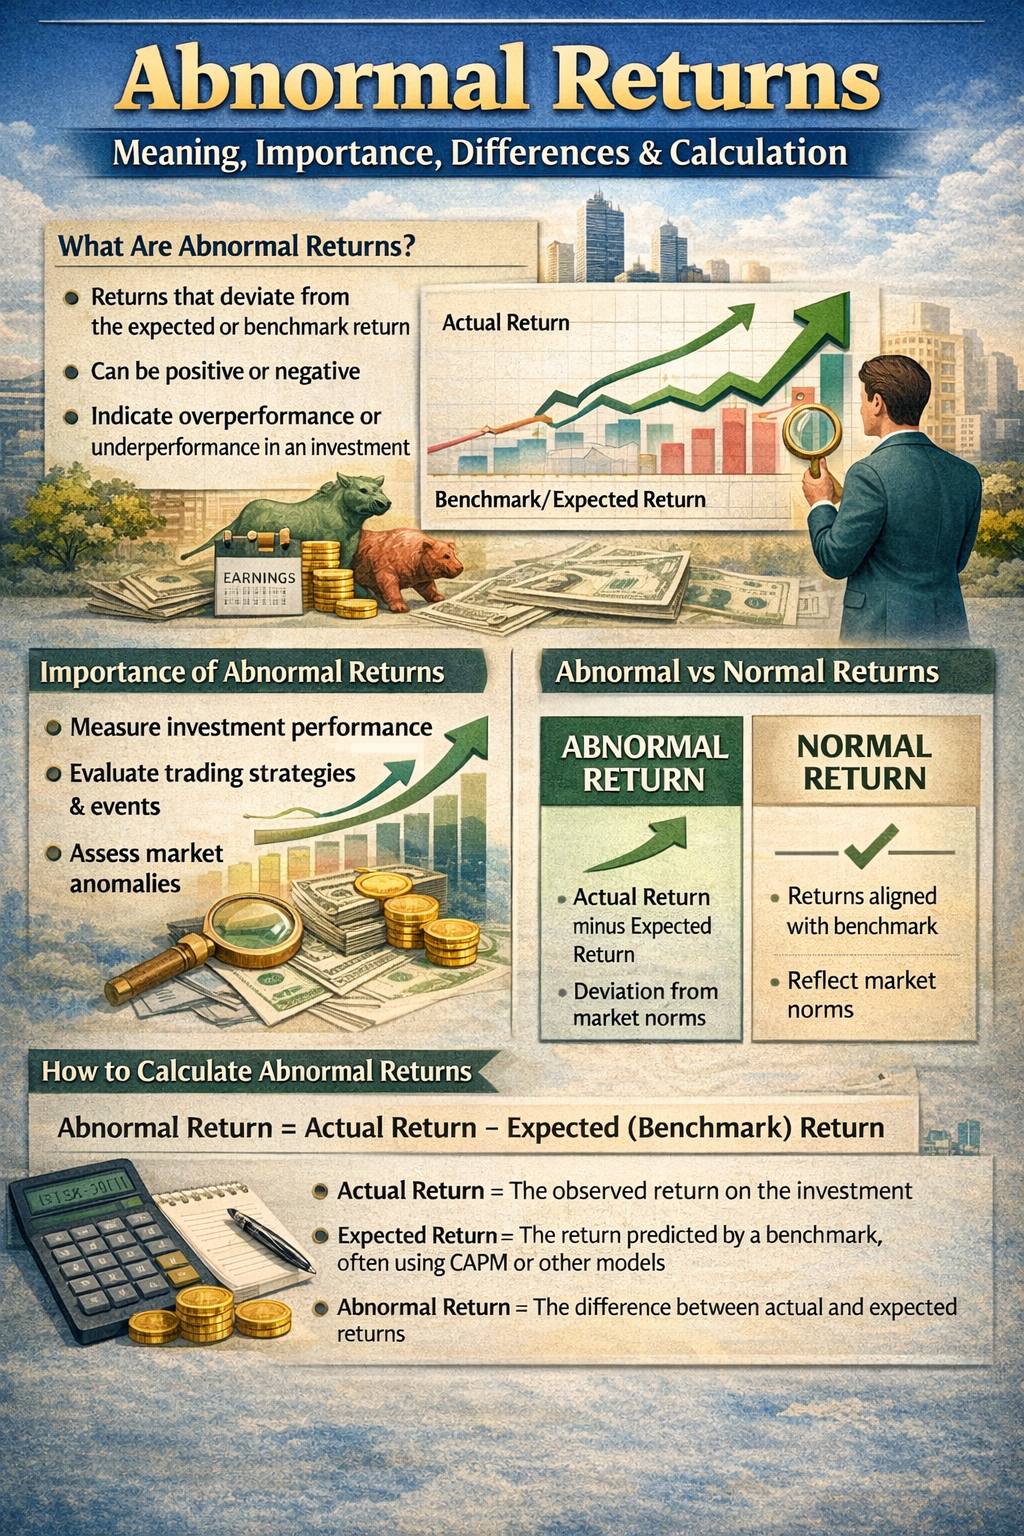
Abnormal returns describe the portion of an investment’s performance that cannot be explained by what was expected. In simple terms, an abnormal return is the gap between what a stock or portfolio actually delivered and what a reasonable model predicted it should deliver. This concept matters because it helps investors separate routine market movement from performance driven by specific events, decisions, or unusual circumstances. Abnormal returns can be positive or negative. A positive abnormal return suggests the investment outperformed expectations, while a negative abnormal return suggests it underperformed. Either direction can carry valuable information, especially when the abnormal movement is large or repeated across time. What Are Abnormal Returns? When investors analyze stocks, they usually focus on actual returns, meaning the profit or loss earned over a period. However, looking only at raw returns can be misleading because markets move for many reasons, including broad economic trends, interest rate shifts, sector cycles, and investor sentiment. Abnormal returns take that context into account by comparing actual performance with expected performance. Expected returns can be estimated using multiple approaches, including historical averages, benchmark comparisons, or models like the Capital Asset Pricing Model (CAPM). If a stock rises 8% but the expected return based on its risk and market conditions was 5%, then the abnormal return is 3%. If the stock delivers 2% when expectations were 5%, the abnormal return is minus 3%. Abnormal returns are especially useful around company-specific events such as earnings announcements, mergers, acquisitions, regulatory actions, product recalls, leadership changes, or lawsuits. In these periods, abnormal returns can highlight how the market responded beyond what general market movement would suggest.
Why Abnormal Returns Matter
Abnormal returns help investors evaluate whether a security’s performance is consistent and dependable or whether it is being influenced by unusual factors. A single abnormal move might not mean much, particularly during periods of market stress or major macroeconomic news. However, repeated abnormal returns in one direction can indicate something meaningful. Chronic negative abnormal returns may suggest poor management decisions, weakening fundamentals, governance concerns, or persistent competitive pressure. In more severe cases, they may point to hidden risks such as aggressive accounting, misleading disclosures, or manipulation. Chronic positive abnormal returns can signal strong execution, improving fundamentals, or strategic decisions that the market did not fully price in earlier. Investors also use abnormal returns to study event impact. A related concept, cumulative abnormal returns, measures abnormal performance across a longer event window, such as the weeks surrounding a lawsuit, buyout rumors, a major product launch, or a regulatory ruling. This approach can help quantify how much value the market gained or lost due to that event.
Abnormal Returns vs. Excess Returns
Abnormal returns and excess returns sound similar, but they describe different ideas. Abnormal returns focus on performance relative to an expected return model, often used to isolate the effect of a specific event or decision. Excess returns focus on performance relative to another reference point, such as a benchmark index, a similar investment, or a risk-free rate. Abnormal returns often relate to a distinct driver, such as a company announcement or a portfolio manager’s decisions. For example, a stock may experience a negative abnormal return after a defective product triggers lawsuits, or a portfolio may generate positive abnormal returns because a manager identified undervalued securities before the market recognized them. Excess returns are typically framed as comparative performance. For instance, if one stock returns 5% and another similar stock returns 7.5% over the same period, the second stock has an excess return of 2.5% over the first. Similarly, if a stock earns 5% while the risk-free rate is 4.5%, the stock’s excess return over the risk-free rate is 0.5%. Excess returns help answer the question of whether an investment beat its alternatives, while abnormal returns help answer whether an investment beat what was expected given its risk and the market environment.
How to Calculate Abnormal Returns
To calculate abnormal returns, you first need the expected return and then compare it to the actual return. A common expected return method uses the CAPM formula: Expected Return (Er) = Rf + β × (Rm − Rf) Er is the expected return Rf is the risk-free rate β is beta, which measures how sensitive the investment is to market movement Rm is the market return or benchmark return Once you have Er, abnormal return is calculated as: Abnormal Return = Actual Return − Expected Return If the result is positive, the investment outperformed expectations. If it is negative, the investment underperformed. A value near zero means the investment performed close to what was predicted, although exact matches are uncommon. Abnormal returns are most useful when applied consistently across time or across event windows. If you calculate abnormal returns around major company events, you can compare how different events influenced stock performance and identify patterns that may improve your decision-making.
Final Thoughts
Abnormal returns are an important tool for understanding what is truly driving an investment’s performance. They help investors go beyond surface-level gains and losses and determine whether results are aligned with expectations or are being shaped by unexpected forces. When used carefully, abnormal returns can support better research, improve event analysis, and strengthen long-term investing discipline.